ECONOMICS FOR MANAGER
By (Name)
Course
Professor’s Name
Institution
Location of Institution
Date
Economics for Manager
Q1
Climate change is a major global issue requiring immediate redress. Arrow’s (2007) article focuses on climate change and its regrettable consequences. The author states that climate change will increase global temperature by 50C due to a high concentration of greenhouse gasses and lower the economic growth by about 1.2% annually by 2200 (Arrow 2007). His main assumptions include that the future cost of global climate change can be avoided by incurring some costs today (Arrow 2007). He reinforces the idea by posing the question whether the benefits of reducing climate change are worth the costs. Arrow (2007) also assumes that people fear risks thus informing them about detrimental effects associated with global warming can greatly reduce emissions. The other assumption is that people are much better off to reduce the emission of CO2 significantly than to suffer and also risk the repercussions of not addressing the issue in the future.
Q2
Arrow (2007) raises an important point that addressing the issue of climate change today is far much better than doing it in the future and risk irreversible repercussions. First and foremost, renowned climate scientists globally warn that there are less than five years to avoid irremediable impacts of climate change which might occur if the average world temperature rises by more than 20C beyond its preindustrial level (ABC 2017). Some of the consequences include an increase in the intensity and frequency of wildfires, increased severity of cyclones, a decrease in rainfall in most regions, increased incidences of drought, acid rain, and extreme temperature.
The annual global emission of carbon dioxide and other greenhouse gases should reverse from rising every year, as it is currently the case, to decreasing annually in order to avoid these and others challenges. According to ABC (2017), the globe has already warmed by about 0.80C above the pre-industrial levels. The author projects that global temperature will rise further by 0.50C as the Earth continues reacting to the emissions previously released in the atmosphere, most of which has remained there for more than ten years. Take together it implies that climate change corresponding to about 1.30C increase in temperature is currently ‘locked in’. The essence of addressing the issue now and not in the future is to avoid additional emissions in order to reverse the situation. The world should try to maintain the rise in temperature at the current level and try to reverse the course gradually.
Exceeding the level of 20C will also decrease the Earth’s low capacity to offset some of the impacts of climate change thus it is imperative to act now. ABC (2017) warns that if the global temperature increase by 2.50C or higher, land ecosystems might release carbon instead of absorbing it. In such case, the ecosystem will contribute to climate change rather than preventing it. IPCC’s (2007) calculations indicate that if the current world temperature increase is to be maintained at 2.00C to 2.40C, then the ‘‘CO2 equivalent’’ concentration should not go beyond between 445 and 490 parts per million (ppm) (ABC 2017). Notably, the “CO2 concentration” is applied as a joint measure of all the Kyoto GHG.
Research shows that the current CO2 equivalent emissions are about 445 but might reach 550ppm by 2035 (Arrow 2007). Arrow (2007) warns that concentration exceeding 445 ppm will raise the temperature by at least 20 C. The author is concerned that continuance of “business as usual” will result in a soaring level of CO2 by 2200 with a 50 percent chance of over and above an increase of 50C (Arrow 2007, p. 2). ABC (2017) suggests the society should halt the increase in the level of global CO2 equivalent by the end of 2017 and then reduce the emissions steadily and drastically thereafter in order to meet the 20 C guardrail target. Although nations, communities, and individuals around the world are putting in place effective strategies to effect the change, more strategies are needed because time remaining to act is short.
Stern (2006) and other top economists have clearly illustrated that climate change results from various market failures that nations need to address to reverse the current global warming trend. One of the greatest failures results from the cost of climate not being included in the prices of services and goods whose production generates greenhouse gas emissions hence leading to notions such as ‘cheap’ fossil (Gillingham and Sweeney 2010, p. 74). However, the governments or environmental regulatory agencies can correct the externality by introducing cost on firms involved in pollution. Such cost might include pollution tax on inputs for goods and services that contribute to pollution or limit pollution. The policy will make the prices rise, and discourage production hence lowering emission of GHGs responsible for climate change. The supply curve of the products will shift to the left (upward). According to Gillingham and Sweeney, if the cost of resources or inputs for production of particular goods increases, manufacturers will be inclined to offer lower quantity at higher prices (2010, p. 1-2). As such, the supply curve will shift towards the left as shown.
Figure 1: Supply Curve Shifts
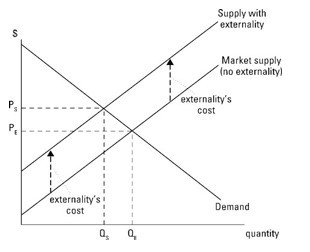
(Source: Graham n. d)
The figure indicates that when the price of resources used to manufacture a particular good is low (PE), the quantity of production is high (QE). However, when the prices increase to PS, the quantity declines to QS. Gillingham and Sweeney suggest the implementation of carbon pricing policies to show precisely how expensive fossil fuels are compared to their alternatives (2010, p. 74). In other words, the governments should create market disincentives to lower production activities that currently increase emission of GHGs. At the moment the high hidden costs of fossil fuels contribute to the terrible damage across the globe to human lives caused by pollution.
Greenhouse gases include carbon dioxide and methane. Report by EPA (n.d) indicates that industrial processes and fossil fuels are the leading sources of CO2 which comprise of about 65 percent of total global GHG. Others sources include human-induced effects on forestry together with other land uses such as soil degradation, land clearing for agriculture, and deforestation. The gases make about 11% of the total GHG. On the other hand, methane contributes about 16% of the global GHG. The main sources of methane gas include agricultural activities, energy use, waste management, and biomass burning. The other sources of GHG include nitrogen gas. The table summarizes components of global GHG emissions by gas.
Table 1: Global GHG Emissions by Gas
|
Gas |
Carbon dioxide (Industrial processes and fossil fuel) |
Methane |
Carbon dioxide (Forestry and other land use activities) |
Nitrogen oxide |
F-gases |
|
Percentage |
65% |
16% |
11% |
6% |
2% |
(Source: EPA n.d)
Figure 2: Global GHG Emissions by Gas
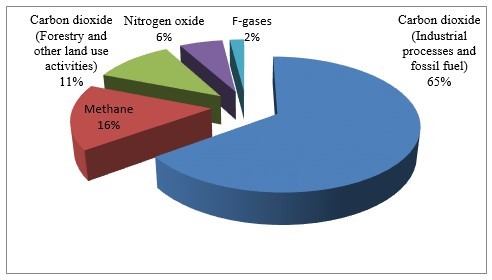
(Source: EPA n.d)
The knowledge about the components of GHG by gas as shown in table 1 and figure 2 is crucial to addressing the issue by targeting a specific source of emission. Such information will help to implement immediate sound policies to reverse the course and avoid future impacts.
The government should also address information market failures which are related to lack of adequate information about the benefits and effectiveness of renewable energy (Gillingham and Sweeney 2010, p. 74). In a perfectly functioning market, profit-maximizing firms should undertake campaigns to inform prospective consumers on various matters such as the benefits of maintaining a clean environment. The government should enforce the policy by holding manufacturers accountable for the use of the products associated with the emission of GHG. Such approaches will lower the emission of GHG and reverse climate change thus preventing an increase in global temperature from exceeding 20C. Overall, it is imperative to reduce GHG emissions and avoid risks of failing to address the issue. However, this can only be attained by the government addressing current market failures.
Q 3
Arrow (2007) presents consumption discount rate δ, as δ = ρ + gη. The term ρ symbolizes the social rate of time preference, η represents the elasticity of social weight associated with the change in consumption while g symbolizes the projected rate of growth of average consumption. The symbol η in the equation shows the possibility that as the rate of use increases, the social value of a marginal unit of consumption decreases. The discount rate refers to the rate used to convert the economic value of the future into the present value (Arrow 2007, p. 2-3). The equation helps to estimate the future loss of consumption given the current rate of consumption of products. In other words, the discount rate estimates future benefits of people against cost incurred by present people (Hodgkinson 2014). Different scholars use different approaches to calculate the value of consumption discount rate.
The main intuition behind the equation is that if people reduce or postpone consumption of goods and services associated with increased GHG emissions currently and not a global agreement that prevents such reduction, the next generation will benefit more than those living today. On the other hand, as the nations continue to use GHG-related products and no measures put in place to mitigate emissions, the level of pollution and global warming will continue rising thus living nothing or little to consume in the future (Arrow 2007; p. 4). As such, nations should lower the current consumption in order to keep the level of CO2 within the bounds.
Uncertainty is lack of precise knowledge in spite of the cause of a given deficiency (Uusitalo, Lehikoinen, Helle, and Myrberg 2015, p. 25). According to Uusitalo et al. (2015), uncertainty is articulated in form of probability and might take various forms. In the case of the rate of growth of average consumption, the value of g might take different directions. Figure 3 indicates the probability distributions for consumption rate.
Figure 3: Uncertainty Distributions
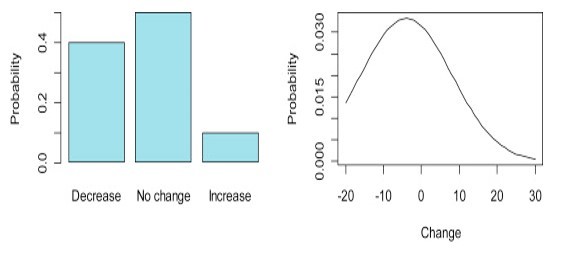
(Source: Uusitalo et al. 2015)
The distribution on the left indicates that there is a 40 percent possibility that the value of consumption rate will decline and 10 percent likelihood that it will rise. However, there is 50% probability that the rate of consumption will not change. On the other hand, the figure on the right indicates that values of consumption rate below zero are more likely to occur than values above zero. However, values slightly below zero and around zero are more likely to occur.
Nonetheless, any kind of uncertainty regarding the average rate of growth of current consumption (g) will lower the consumption discount rate (δ). For example, holding other factors constant, if the average consumption growth rate declines or people lower or postpone their current consumption of goods and services associated with the emission of GHGs, the value of δ will decline as shown in the equation. Notably, δ is the sum total of ρ and gη. In other words, if people postpone or reduce their consumption now, they will have more goods and services to consume in the future. Similarly, if the rate of growth of consumption of GHGs related products increases, people will have little to consume in the future implying that the value of δ will also decline. In the same way, even if the current average consumption rate remains constant, the quantity of goods and services available will continue to decrease thus lowering the value of consumption discount rate.
Human activities are one of the major causes of global warming. In this regard, when human-induced global warming continues to occur, the value of δ will remain low. The low value of δ in the economy implies that the country needs to prevent human activities associated with global warming or reduce the use of goods and services that contribute to climate change. Failure to enforce such strategy will lead to irreversible consequences such as regular droughts and wildfires.
Q4
Australia is one of the world’s leading emitters of GHG. According to Plumer (2014), Australia is among the countries with highest emissions per person rates globally. However, the country has been in the front in the efforts to reduce the emission of GHG. Schiermeier’s (2014) report indicates that the country established a carbon tax in 2012 to reduce the emission of carbon and other GHG emissions. The scheme enabled the country to hold all firms liable to all their emissions thus greatly reducing emission. For example, the policy raised about Aus$6.6billion equal to US$6 billion from about 350 high polluting firms from 2012 to 2013. The companies were required to pay Aus$24 for each tonne of carbon dioxide which they emitted. As evident from the statistics, the country prevented the reckless emission of GHG responsible for climate change (Nordhaus 2007, Morton 2017).
In the context of Arrow’s (2007) equation δ = ρ + gη, Australia had a low value of g until 2014 when the country decided to terminate the carbon tax scheme. That is, the country was willing to postpone its current consumption for future consumption. It also implied that the country’s value of social time preference (ρ) was positive or more than zero. Therefore, it can also be argued that Australia’s consumption discount rate (δ) was high. Indeed, Australia was committed to the Paris Climate Accord. Although the carbon tax did not completely prevent emissions, it lowered the rate of emission. The figure illustrates the trend of Australia’s emission from 1999 to 2020.
Figure 4: Australia’s GHG Emission 1999-2020.
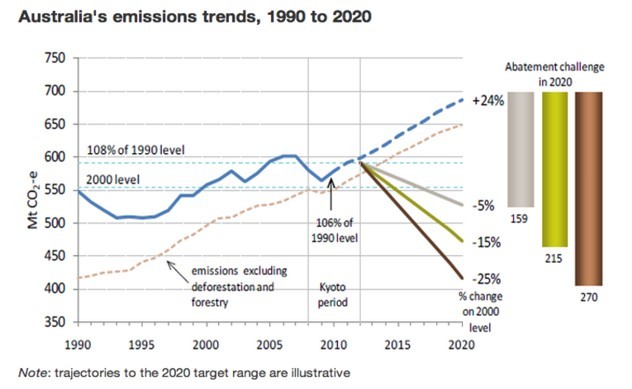
(Source: Minchin and Hopkin 2014)
Figure 4 illustrates that the level of GHG emissions in Australia has been manageable over time. The trend can be attributed to country’s effort to mitigate emissions whose peak was the introduction of the carbon tax in 2012 (Plumer 2014). However, the scheme operated for only 2 years before it was abolished. The country repealed the carbon tax in 2014 thus giving way for firms to engage in the unrestricted generation of electricity and gas from coal and other resources associated with GHG emissions. Plumer (2014) feels that the repeal is a great blow for the alleviation of climate change. He argues that carbon tax is one of the most efficient ways to lessen global warming (Plumer 2014). The argument is valid because making fossil fuels expensive could spur firms to seek out cleaner alternative energy sources.
Nonetheless, Australia is still committed to reducing GHG emission by 5% below 2000 levels by the end of 2020. However, experts feel that carbon tax repeal will make it hard for the country to reduce emission by this level. Indeed, the emissions have increased significantly after the carbon tax repeal. The table demonstrates Australia’s GHG from 2010 to 2017.
Table 2: Australia GHG Emission 2010-2017
|
Year |
2010 |
2011 |
2012 |
2013 |
2014 |
2015 |
2016 |
2017 |
|
Emission (MtCO2-e) |
140 |
136.6 |
135 |
130.1 |
132.5 |
132.3 |
135.6 |
138.7 |
(Source: Slezak 2017)
Figure 5: Australia GHG Emission 2010-2017
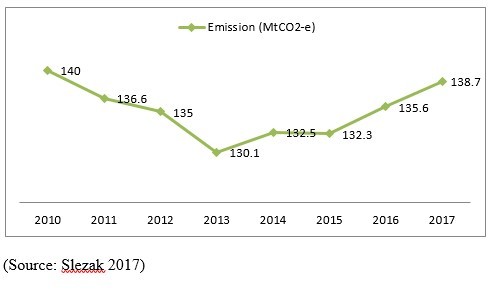
As evident on table 2 and figure 5, Australia’s level of GHG emission declined gradually from 2010 to 2012. It declined steadily further from 2012 to 2013 after the establishment of the carbon tax. However, the emission started increasing since 2014 to date after the country repealed the carbon tax scheme.
In relation to Arrow’s (2007) δ = ρ + gη, Australia’s decision to withdraw the carbon tax has increased in average consumption growth rate (g) disregarding the future consumption. The country’s reverse action implies that it has lowered its social rate of time preference. As a result, country’s consumption discount rate (δ) will decline considerably. Apparently, Australia is not willing to postpone its consumption today for consumption in the future. Currently, the country emits GHG gases thus is likely to cause damages leading lower consumption in the future.
Q5
In the equation δ = ρ + gη, the parameter ρ symbolizes the social rate of time preference (SRTP). According to Arrow (2007), SRTP is the measure of the society or nation’s willingness to postpone consumption currently in order to consume later. There is still disagreement among philosophers and top economists regarding the appropriate value of ρ. Some of them use zero but assume the society still exist while others use 1, 2, or 3. However, there is no simple revealed preference or positive measure that can be said to be the right way of determining the consumption discount rate. As Arrow (2007) argues, it is fundamentally a matter of a ‘moral’ choice.
President Donald Trump’s resolution to pull out the U.S. from the Paris Climate Accord implies that the U.S. is not willing to postpone its consumption of goods and services associated with the emission of GHG in order to consume later and avoid damages associated climate change. According to Arrow (2007), a positive social time preference not only prevents discrimination against future generations but is also important for fairer intergenerational allocation of resources. President Trump’s decision implies that the country places zero value for social time preference.
Notably, the U.S. is among the global leading emitters of GHG. According to EPA (n.d), the country emits about 30% of the total global GHG emissions. As such, the country should also lead in the efforts to cut current consumption of products whose production contributes to detrimental climate change. According to Nordhaus (2007), a positive social rate of time preference is rationalized on the basis of deliberate selfishness or myopic behavior of the current generations. The U.S. decision to hold back its contribution to the mitigation of climate change implies that the country increases its projected growth rate of average consumption (g). The implication for the other countries or the world is that the value of consumption discounted rate decreases significantly. In other words, the world will be disadvantaged due to increased damages resulting from the U.S. current actions.
A positive or high consumption discount rate acts as a compensating tool against the built-in bias in favor of the world. In the event a country uses a zero value for social time preference, it implies that it has a preference for welfare which is gained over the welfare which will be attained later. However, this should not be the case especially if the action affects many people or countries. Nordhaus (2007) affirms that such action will constitute an obvious failure to respect the distinctness of other countries.
President Trump’s decision not to commit the country to the reduction of emission of GHG implies that he views the welfare of the world as less important than the U.S. welfare. Although the decision does not mean that the country will deliberately continue emitting GHG, it shows clearly that country is not ready to take responsibility for the damages resulting from its GHG-related activities. As a result, the world will incur high cost in the future due to such damages. Overall, the U.S’s current high consumption growth rate lowers the value of consumption discount rate for the rest of the world.
References
ABC, 2017. Why we must act now to reduce greenhouse gas emissions. ABC Science. [Online]. Available at http://www.abc.net.au/science/articles/2009/11/25/2753561.htm
Arrow, K.J., 2007. Global climate change: A challenge to policy. The Economists' Voice, 4(3): 1-5.
EPA, n.d. Greenhouse gas emissions. [Online]. Available at https://www.epa.gov/ghgemissions/global-greenhouse-gas-emissions-data
Gillingham, K. and Sweeney, J., 2010. Market failure and the structure of externalities. Harnessing Renewable Energy in Electric Power Systems: Theory, Practice, 69-92.
Graham, R. J., n.d. Basics of externalities in managerial economics. [Online]. Available at http://www.dummies.com/education/economics/basics-of-externalities-in-managerial-economics/
Hodgkinson, D., 2014. Thomas Piketty, climate change and discounting our future. The Conversation, August 11, 2014. [Online]. Available at http://theconversation.com/thomas-piketty-climate-change-and-discounting-our-future-30157
Minchin, L. and Hopkin, M., 2014. Carbon tax axed: how it affects you, Australia and our emissions. The Conversation, 14 July 2014. [Online]. Available at https://theconversation.com/carbon-tax-axed-how-it-affects-you-australia-and-our-emissions-28895
Morton, A., 2017. Energy crisis: Wholesale power prices have doubled since the carbon tax was axed. Sydney Morning Herald, 9 March 2017. [Online]. Available at http://www.smh.com.au/federal-politics/political-news/energy-crisis-wholesale-power-prices-have-doubled-since-the-carbon-tax-was-axed-20170308-gutf8t.html
Morton, A., 2017. Energy crisis: Wholesale power prices have doubled since the carbon tax was axed. [Online]. Available at http://www.smh.com.au/federal-politics/political-news/energy-crisis-wholesale-power-prices-have-doubled-since-the-carbon-tax-was-axed-20170308-gutf8t.html
Nordhaus, W.J., 2007. Critical assumptions in the Stern Review on climate change. Science Magazine’s State of the Planet 2008-2009: With a special section on energy and sustainability. Science, 317, 201-202.
Plumer, B., 2014. Australia is repealing its controversial carbon tax. Vox, 17 July 2014. [Online]. Available at https://www.vox.com/2014/7/17/5912143/australia-repeals-carbon-tax-global-warming
Schiermeier, Q., 2014. Anger as Australia dumps carbon tax: Climate experts decry the demise of the emissions-control system. Nature News, 22 July 2014. [Online]. Available at http://www.nature.com/news/anger-as-australia-dumps-carbon-tax-1.15601
Slezak, M., 2017. Australia's greenhouse gas emissions soar in latest figures. The Guardian, 4 August 2017. [Online]. Available at https://www.theguardian.com/australia-news/2017/aug/04/australias-greenhouse-gas-emissions-soar-in-latest-figures
Stern, N., 2006. The economics of climate change. [Online]. Available at http://mudancasclimaticas.cptec.inpe.br/~rmclima/pdfs/destaques/
sternreview_report_complete.pdf
Uusitalo, L., Lehikoinen, A., Helle, I. and Myrberg, K., 2015. An overview of methods to evaluate the uncertainty of deterministic models in decision support. Environmental Modelling & Software, 63, 24-31.